|
Objective: Make observations and record oscillating frequency data for different model geometries, cylindrical and prismatic, to understand the effect of different shapes on the vortex shedding explained on the first portion of this report.
The significance of the experiment is that the optimum geometry will produce the highest frequencies in order to obtain optimum power from tides.
Background: It has been observed on previous experiments that different bluff bodied shapes cause different types of vortices. See figures 4 for the model schematics that were used on this experiment.
Figure 4: Configurations used in the Experiment
Model A: Cylindrical shape with a fin that does not have an attachment at the end.
Model B: Cylindrical shape with a fin that does have an attachment at the end.
Model C: Prismatic shape with a fin that does not have an attachment at the end.
Model D: Prismatic shape with a fin that does have a attachment at the end.
Equipment:
- 4 Plexiglass fins: with lengths of 1.5, 2, 2.5, and 3 inch long respectively all with 2 inch height and 1/8 inch thickness.
- Cylindrical tube model, refer to figure 4
- Prismatic tube model, refer to figure 4
- Cylindrical fin attachment
- Flow tank
- Digital time recording device (+/- 0.5 second precision)
Methodology:
1) Turn on flow tank, establish a constant velocity flow in the tank; be sure that equipment is operating at optimal conditions
2) Record difference in manometers for pumps one and two using the gages on the side of the device
3) Calculate total flow rate from information in step 2
4) Use calculated flow rate in order to determine the velocity and the Reynolds number for water in the flow tank
5) Place Cylindrical tube model with 1.5 inch Plexiglass fin, without cylindrical fin attachment into the wave tank centered between the walls that are parallel to the flow
6) Using a digital time recording device count the number of the oscillations within a 60 second interval, 3 times simultaneously.
7) Repeat the above steps using the model geometry combinations described in figure 4
Results:
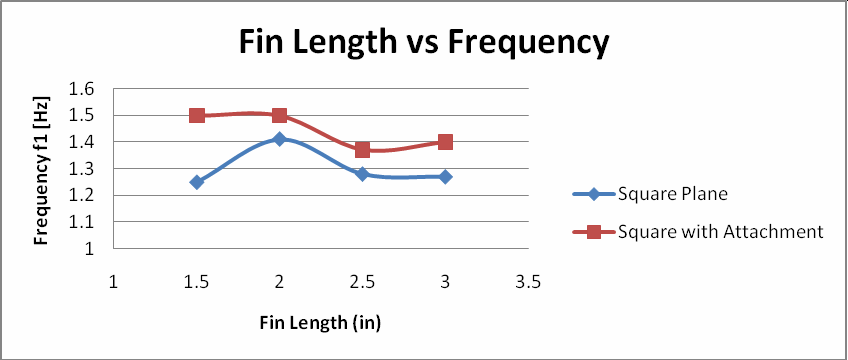
Table 1 shows the results for the prismatic attachment for fin lengths 1.5, 2, 2.5, and 3 inch respectively along with recorded frequency and gain due to fin attachment.
Table 1: Prismatic geometry results
|
Fin Length
(in)
|
Square Plane
|
Square with
Attachment
|
Gain f2/f1
|
|
Frequency f1 [Hz]
|
Frequency f2 [Hz]
|
|
1.5
|
1.25
|
1.5
|
1.2
|
|
2
|
1.41
|
1.5
|
1.06
|
|
2.5
|
1.28
|
1.37
|
1.07
|
|
3
|
1.27
|
1.4
|
1.10
|
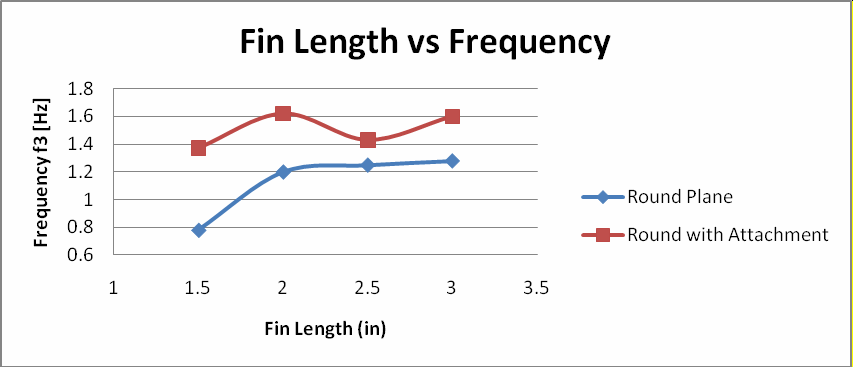
Table 2 shows the results for the cylindrical attachment for fin lengths 1.5, 2, 2.5, and 3 inch respectively along with recorded frequency and gain due to fin attachment.
Table 2: Cylindrical geometry results
|
Fin Length
(in)
|
Round Plane
|
Round with
Attachment
|
Gain f4/f3
|
|
Frequency f3
[Hz]
|
Frequency f4 [Hz]
|
|
1.5
|
0.78
|
1.37
|
1.76
|
|
2
|
1.2
|
1.62
|
1.35
|
|
2.5
|
1.25
|
1.43
|
1.14
|
|
3
|
1.28
|
1.6
|
1.25
|
Table 3 shows the general wave tank conditions found; these values were kept constant.Table 3: General conditions
|
Test 1
|
Constant Values
|
|
Velocity ( m/s)
|
0.35
|
|
H ( in)
|
4.6
|
|
Re
|
88872.4
|
Discussion:
Figure 5 illustrates that adding the attachment to the fin will generally result in a higher frequency. There appears to be an optimum fin length of approximately 2 inches, regardless of whether there is an attachment or not.

Figure5. Fin length vs. frequency for square geometry
Similarly to the square geometry, Figure 3 illustrates that adding the attachment to the fin will generally result in a higher frequency. However, the current set of data does not indicate a clear optimal fin length; more data needs to be collected to determine
a general trend with respect to fin length.

Figure 6. Fin length vs. frequency for square geometry
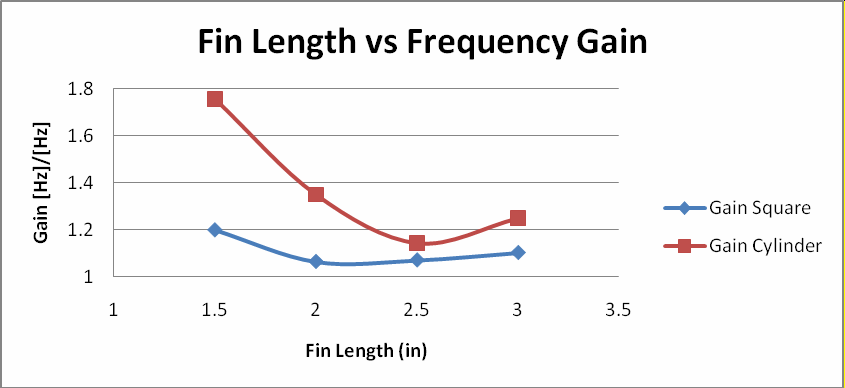
The highest gain due to the addition of an attachment was found to be 1.76 for the cylindrical model geometry. It was postulated that the reason the circular model with attachment has a higher frequency than the square model with attachment is because the
geometry of the square model causes the detachment point to be further away from the optimal point of contact with the fin and attachment. See Figure 7 for a diagram of Fin length vs Gain of frequency.

Figure 7. Fin length vs. gain of square and cylindrical shapes
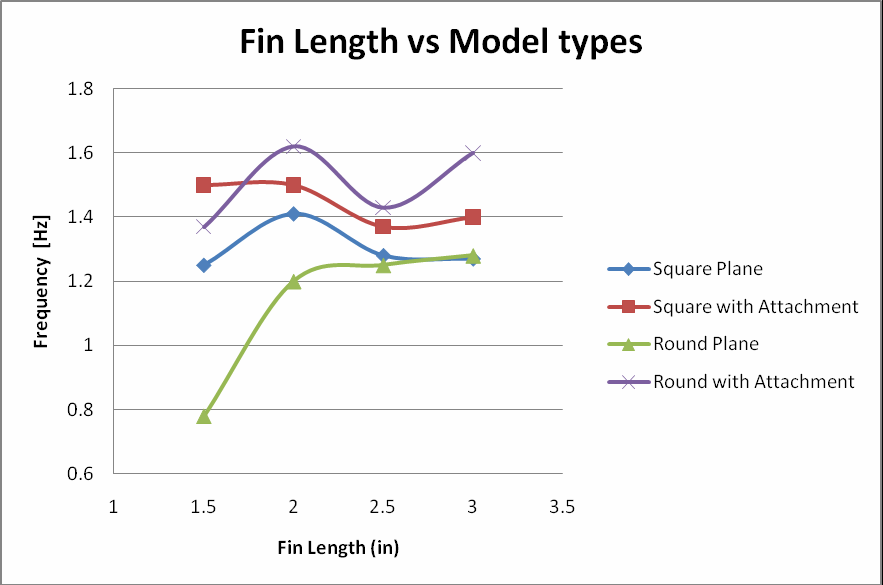
Comparing all model types, we can see that the average frequency for the round model without attachment always has the lowest frequency. In general the round with attachment has the highest frequency of oscillation for the models tested. From this
experiment we found that the models with fin attachments had higher frequencies (See figure 8).

Figure 8. Fin length vs. frequency of square and cylindrical shapes
Conclusion:
This experiment was important because it helped to understand the effects of different model geometries on the oscillation frequency of the fin. This will in turn help decide which model type will generate the highest frequency and in turn power a motor.
Error Analysis:
There were four fin lengths used in this experiment which provided an insufficient amount of data in order to properly predict the variation of frequencies due to the overall geometry. Additional testing of multiple configurations with additional trials
per configuration will help eliminate this type of error. Other possible sources of error include miscounting of oscillations due to the existence of primary and secondary oscillations from the pump.
|